It is appalling to see how technology is making our work easier. What was impossible to think of in the past decade is becoming practically possible.

Who thought flawless remote working was possible? And let us tell you, although the pandemic accelerated the remote work and digitalization process, the foundation was laid way before that. And all this is possible due to the innovation and interaction technology allows.

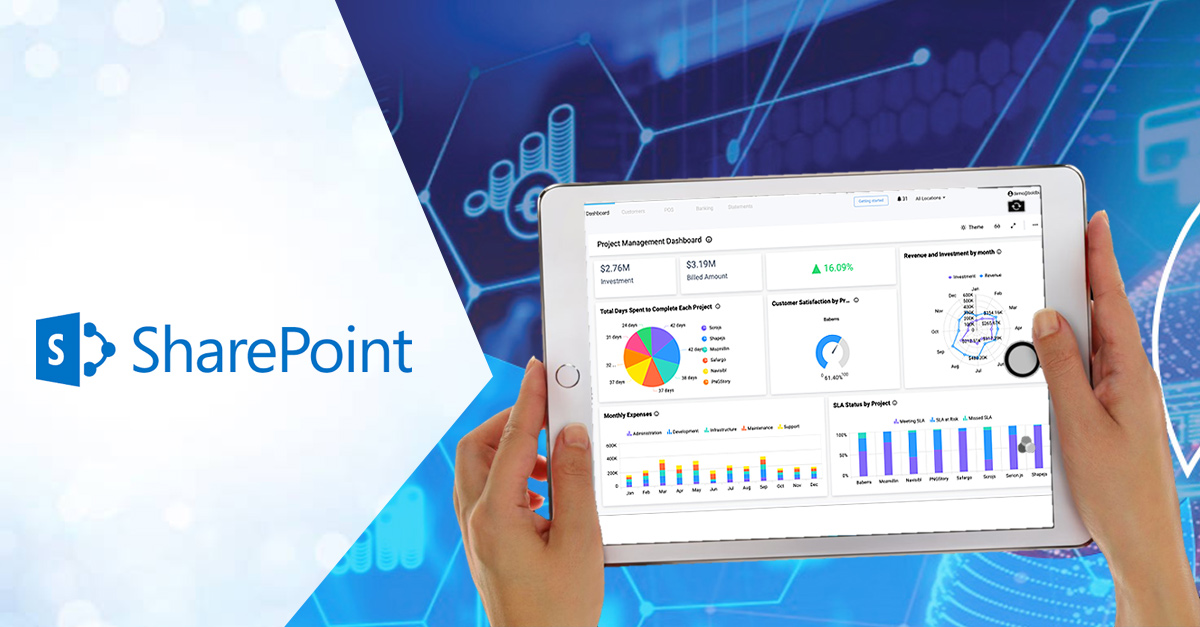
And Sharepoint and Teams allow such seamless integrations. You can source data and visualize them into appealing and easy-to-understand reports. Also, you can customize dashboards and have one-click access to information.

Well, there is so much to reporting and dashboarding with Sharepoint and Teams that by the end of this article, you will be astonished as to why you did not introduce them earlier into your system! But as the saying goes, better late than never!

How SharePoint and Teams Enhance Reporting and Dashboarding

Let us begin with the benefits of the integration and later discuss the technical details.

SharePoint and Teams can enhance reporting and dashboarding by providing a centralized platform for data storage, analysis, and visualization.

Here are a few ways in which these platforms can be used to enhance reporting and dashboarding:

Data storage and organization

SharePoint and Teams provide a centralized location for data storage and organization, making accessing and managing data easier. This makes it easier to pull data for reporting and dashboarding.

Integration with Power BI

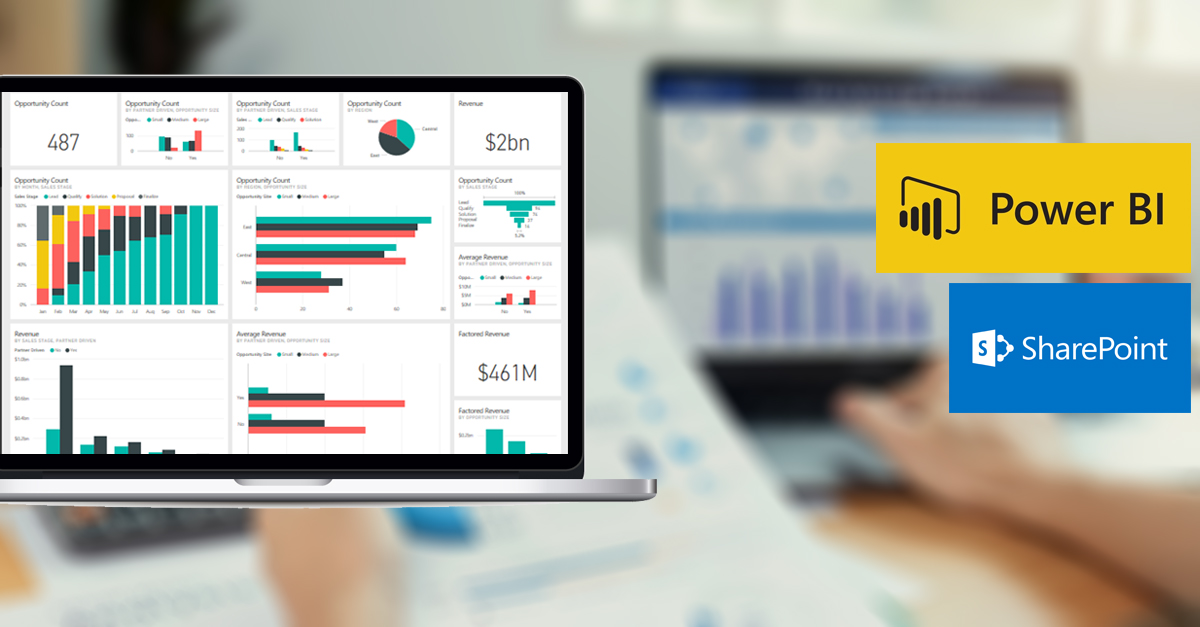
Both SharePoint and Teams integrate seamlessly with Power BI, a powerful data visualization tool. This integration allows users to create interactive dashboards and reports that can be easily shared with others.

Customization

SharePoint and Teams allow for the customization of reports and dashboards to fit specific needs. You can customize data visualizations, data connections, and data refresh schedules, among other things.

Collaboration

Teams allow for collaboration among team members in real time. This feature enables users to work together to create reports and dashboards, share insights, and make data-driven decisions.

Mobile Accessibility

SharePoint and Teams can be accessed on mobile devices, making it easier to stay connected to data and collaborate with team members, even on the go.

Therefore, SharePoint and Teams provide a robust platform that can significantly enhance reporting and dashboarding capabilities.

The Technical Stuff

Here are some technical details about this powerful integration to get started. Do not worry; it is not rocket science—just explanations of some basic jargon and how they can make a notable difference in the organizational processes.

Interactive Reporting

Say, you need to present a sales report for a presentation.

Using Power Sales Apps, you can create workflows to automatically update your sales data in real-time. Sales data is extracted from various sources, and you can analyze it accordingly. Post that, import the data into Power BI, and you have the interactive, visually appealing, and colorful report generated within no time.

Quick Chart Web Part

The Quick Chart Web Part is a feature in SharePoint that allows users to create and display simple charts and graphs directly on a SharePoint page. It supports several charts, including bar, column, line, pie, and doughnut charts. To use the Quick Chart Web Part, you can add it to a SharePoint page, configure the chart’s settings, and add data to the chart either manually or by connecting it to a data source such as a SharePoint list or Excel workbook. Simple as it sounds!

Script Editor Web Part

This requires technical assistance, so be careful if you want to use this approach.

The Script Editor Web Part is a feature in SharePoint that allows users to add custom code, such as HTML, JavaScript, and CSS, to a SharePoint page. It is a flexible way to add custom functionality and styling to SharePoint pages unavailable through the standard SharePoint interface.

To use the Script Editor Web Part, add it to a SharePoint page, and then use the editor to add their custom code. The editor supports syntax highlighting and code completion, which makes it easy to write and edit code. Users can also preview their changes in real-time using the page preview feature.

Sharepoint Dashboard

A SharePoint dashboard is a web page that displays key performance indicators (KPIs), metrics, and data visualizations in a single location. It allows users to view and analyze data in real time quickly, and they can be customized to meet the specific needs of a team or organization.

Excel Reports

Excel is an action-packed client of Power BI. Data from the Excel workbook is imported into Power BI and used to create interactive dashboards and reports. Excel reports can be connected to data sources, including cloud-based services, such as Dynamics 365, and on-premises data sources, such as SQL Server databases.

Paginated Reports

Paginated Reports are a type of report format in Power BI that allow users to create highly formatted, pixel-perfect reports. They were previously known as SQL Server Reporting Services (SSRS) reports.

Paginated Reports are designed to handle large amounts of data and support a wide range of data sources, including relational databases, multidimensional databases, and web services. Their formatting and layout options include tables, charts, maps, and images, allowing users to customize the look and feel of their reports.

Sharepoint Pages and Teams

Using SharePoint pages in Teams provides a powerful way to collaborate and manage documents in a centralized location.

  • Create a SharePoint page

  • Add the SharePoint page as a tab in Teams

  • Customize the tab settings

  • Collaborate on the SharePoint page

Once the SharePoint page is added as a tab in Teams, you can collaborate on the documents and information on the page. You can co-author documents, leave comments, and chat with team members directly within Teams.

To Sum It All Up

With the powerful collaboration of Sharepoint Pages, Teams, and Power Apps, teams can work more efficiently and effectively. Whether your services are in the cloud, on-premise, or have a hybrid structure, the collaboration of these incredible tools will surely take your reporting and dashboarding to the next level!

That’s All, Folks

Business challenges emerge in every sector, but the actual game is experimenting with the latest technologies. This lets you know what works best for you, your organization, and your work culture.

If you still have questions, contact IT experts to drive better business outcomes and support priorities.

By Categories: SharePoint

Related Post